The three formulas of Nilsson provide the relative change in the number of accidents, i.e. in percentages. They take account of the severity and they take account of the speed level at a particular road. Based on these formulas, the expected change in accidents when average speed changes with 1 km/h is:
| Reference Speed | 50 km/h | 70 km/h | 80 km/h | 90 km/h | 100 km/h | 120 km/h |
|---|---|---|---|---|---|---|
| Injury accidents | 4.0% | 2.9% | 2.5% | 2.2% | 2.0% | 1.7% |
| Serious injury accidents | 6.1% | 4.3% | 3.8% | 3.4% | 3.0% | 2.5% |
| Fatal accidents | 8.2% | 5.9% | 5.1% | 4.5% | 4.1% | 3.3% |
On average, this suggests that a 1% change in speed would lead to a 2% change in injury accidents, a 3% change in severe injury accidents and a 4% change in fatal accidents.
Actual accident changes on a particular road will depend on a range of road and traffic characteristics that interact with speed and also on the characteristics and behaviour of the drivers using the road, such as age, gender, drink-driving and seatbelt wearing.
The injury risk is highest in light vehicles and for unprotected road users
When a heavy and a light vehicle collide, the occupants of light vehicles are far more at risk to sustain serious injury. This is because the energy that is released in the collision is mainly absorbed by the lighter vehicle. Currently, the differences in mass between vehicles are very large. The difference between a heavy goods vehicle and a car can easily be a factor 20. But also the mass differences between cars are large and still increasing. A mass difference of a factor 3 is not an exception. Nevertheless inappropriate speed remains a larger factor than mass differences in contributing to numbers of severe accidents.
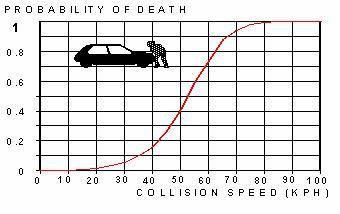
Pedestrians, cyclists and moped riders have a large risk of severe injury when colliding with a motor vehicle. The difference in mass is huge and the collision energy is mainly absorbed by the lighter 'object'. In addition, pedestrians, cyclists and moped riders are completely unprotected: no iron framework, no seatbelts, and no airbags to absorb part of the energy. For a collision between a car and a pedestrian, the following relationship between speed and survival chance was established Ashton and Mackay (1979).
| Car Speed | % fatally injured pedestrians |
|---|---|
| 32 km/h | 5 |
| 48 km/h | 45 |
| 64 km/h | 85 |
And as a graph the probability of fatal injury for a pedestrian colliding with a vehicle looks like this (source: Pasanen, 1991):