Data considerations
- Age groups most involved in fatal crashes
- Collision partners
- Contributory factors
- Crash characteristics: where and how?
- Crossing facilities
- General trends in number of fatalities
- Road types
- Share of pedestrian and cyclist fatalities
Data considerations
Which crashes and injuries are traffic-related and how well are they reported in police crash statistics
Definition of a traffic-related crash
Not all crashes involving pedestrians and/or cyclists are considered to be traffic-related. According to the UNECE definition, road traffic accidents are those accidents:
a) Which occurred or originated on a way or street open to public traffic
b) Which resulted in one or more persons being killed or injured and
c) In which at least one moving vehicle was involved.
These accidents therefore include collisions between vehicles, between vehicles and pedestrians, and between vehicles and animals or fixed obstacles. Single vehicle accidents, in which one vehicle alone (and no other road user) was involved, are included. Multi-vehicle collisions are counted as only one accident provided that the successive collisions happen at very short intervals. United Nations Economic Commission for Europe, 2005
As a result, an accident in which a pedestrian fell as a result of loose paving stones is not regarded as a traffic accident. The same applies for an accident in which a pedestrian fell while boarding or alighting from a bus.
Certain types of crashes are underreported
Pedestrian and cyclist crashes are heavily and disproportionally underreported in the police crash statistics compared to what hospital records and other studies show [34][20]. Data from Great Britain and the Netherlands clearly show that the amount of under-representation becomes larger as the victim's transport mode changes from passenger car to cyclist (Table 2.) The table below also shows that the level of under-representation increases as injury severity decreases. For all severities, casualties among cyclists are far less reported in comparison with casualties among other road users. Cycle accidents in which no other vehicle was involved are heavily under-reported. Examples of such accidents are accidents in which the cyclist fell, slipped, or collided with an obstacle.
|   | Great Britain | The Netherlands | ||||
|---|---|---|---|---|---|---|
| Fatal | Severe | Slight | Fatal | Hospitalised | Slight | |
| Passenger car | 100% | 89% | 77% | 96% | 92% | 33% |
| Motorcycle/scooter | 100% | 70% | 51% | 94% | 63% | 13% |
| Bicycle | 100% | 33% | 21% | 86% | 31% | 4% |
| Pedestrian | 100% | 85% | 67% | 90% | 56% | 20% |
| Total | 100% | 76% | 62% | 93% | 60% | 13% |
Table 2 Percentages of casualties reported. Source: OECD, 1998, SWOV-AVV
Risk and measurement of exposure
Comparing the number of crashes among cyclists and pedestrians with those among car drivers and/or passengers, introduces a number of problems. First of all, as car trips are dominant, and the trip length of car drivers is much longer than that of non-motorised road users such as pedestrians or cyclists, it is logical that the largest percentage of all crashes is that of car drivers and/or passengers. Therefore, the amount of exposure should be included in the comparison of crash numbers. Usually exposure is measured by the number of trips or the number of kilometres travelled. Another, maybe more representative exposure measure would be hours spent in traffic. A calculation performed in the United Kingdom, using data from 1988, shows how differences in casualty rates vary with the unit of exposure chosen:
|   | Fatalities | Fatality rate per 100 million. | ||
|---|---|---|---|---|
| Trips | kilometres | hours | ||
| Passenger car | 2142 | 5.2 | 0.4 | 12.4 |
| Motorcycle/scooter | 670 | 122 | 11.4 | 342 |
| Bicycle | 227 | 12.5 | 4.6 | 64 |
| Pedestrian | 1753 | 7 | 6.6 | 27 |
Table 3 Number of casualties per units travelled by different types of road users in 1988. Source: PROMISING [40]
This table shows that, based on the fatality rate in terms of distance (km), walking is about 16 times more dangerous than car travel. However, in terms of time spent travelling, the risks are more similar, with walking being two times more dangerous than being in a car. In terms of number of trips, the risk of walking and driving a car is about the same [60]
A second problem that is introduced when comparing crashes among cyclists and pedestrians with those among car drivers and/or passengers relates to the roads they use. More than one third of all car kilometres are driven on highways that have been made very safe. If only those roads are considered which are also used by cyclists and pedestrians, the crash rate for car driving will be higher [60].
Thirdly, less easily quantifiable measures such as the level of congestion of the roads or behavioural factors such as whether children are accompanied on their journeys also affect exposure to risk. The same applies for cycling experience. The more experienced a cyclist is, the lower his fatality rate is, and vice versa. Not only individual kilometrage matters. Crash rates are also related to the total of amount of cycling in a country. In countries where people cycle a lot, cyclists in general have a lower fatality rate. A similar inverse relationship exists for the number of pedestrians or cyclists crossing at intersections. Summersgill et al.[46] have shown that for pedestrians crossing at intersections, increasing pedestrian flows result in lower crash rates per crossing pedestrian[60][40].
Keeping in mind the limitations that are attached to the use of crash and fatality rates, the figure below gives an indication of the fatality rates for different age groups while walking, cycling, riding a motorcycle, and driving a passenger car:
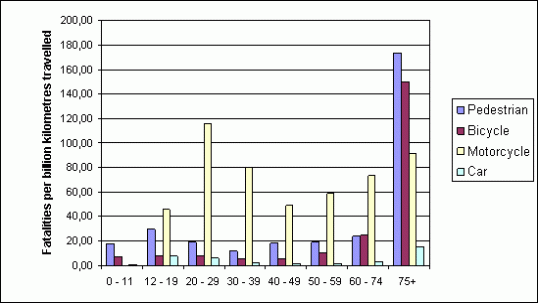
Figure 1 Fatalities per billion kilometres travelled in the Netherlands; 2001-2005. Source: Dutch Ministry of Transport/Statistics Netherlands